Sin plot
plot(1:100, sin(1:100))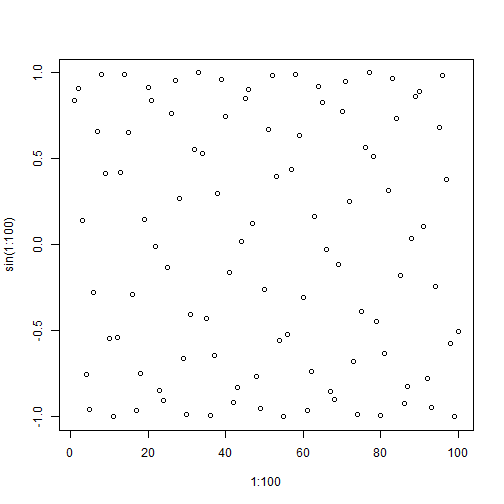
library(lubridate)
library(tibble)
library(dplyr)
library(tidyr)
library(ggplot2)
library(forcats)
library(purrr)

set.seed(1234)

sales <- tibble(date = ymd(rep(c(20180101, 20180102, 20180103), 3)),
                product = rep(c("A", "B", "C"), each = 3),
                sales = sample(1:20, size = 9, replace = T))
sales
## # A tibble: 9 x 3
## date product sales
## <date> <chr> <int>
## 1 2018-01-01 A 3
## 2 2018-01-02 A 13
## 3 2018-01-03 A 13
## 4 2018-01-01 B 13
## 5 2018-01-02 B 18
## 6 2018-01-03 B 13
## 7 2018-01-01 C 1
## 8 2018-01-02 C 5
## 9 2018-01-03 C 14library(corrr)library(dplyr)
library(tidyr)
sales %>%
spread(key = product, value = sales) %>%
select(-date) %>%
correlate() %>%
shave() %>%
stretch(na.rm = TRUE)## # A tibble: 3 x 3
## x y r
## <chr> <chr> <dbl>
## 1 A B 0.5
## 2 A C 0.737
## 3 B C -0.217